Uncategorized
The Economist Releases Intelligence Report on Political and Economic Outlook of Nigeria
Published
8 years agoon
By
Eric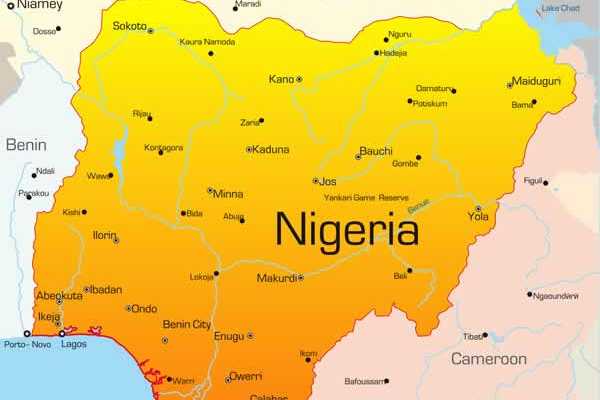

The Economist has released a report on the political and economic activities of Nigeria. The report which was originally published on September 6 is tagged Economist Intelligence Unit Report’
Below is the details of the report in words and original PDF copy:
Political and economic outlook
• The president, Muhammadu Buhari, is expected to lose power at the February 2019
general election. The next government will be led by the main opposition, the People’s
Democratic Party, although this administration will be volatile.
• Without a party system based on shared principles and without any clear direction, there
will be no way of bringing Nigeria’s multi-layered security threats under control.
Instability and legislative paralysis will affect many aspects of the economic forecast.
• Policy reform will be slow as efforts to introduce market-oriented reforms and diversify
the economy away from oil come up against vested interests, ideological opposition and
bureaucratic inefficiency.
• Real GDP growth will accelerate from sluggish levels in 2017 but only slowly, given
ongoing policy deficiencies, infrastructure gaps and political instability, which will sap
confidence in the economy more generally.
• Inflation will come down from the highs recorded in early 2017, but price pressures from
election spending and expected currency devaluation over 2019-21 will persist and keep
average annual inflation in double digits.
• Prospects for the current account will remain largely tied to oil prices and the moderate
recovery expected in import demand after two years of contraction. A current-account
surplus will be recorded throughout 2018-22, but it will be well below historical highs.
• Mass defections from the ruling All Progressives Congress (APC) and a weak response
from the president means that The Economist Intelligence Unit no longer expects
Mr Buhari to win a second term at the February 2019 presidential election.
• We now expect the nominated candidate of the opposition’s People’s Democratic Party
(PDP) to form the next government, but for the administration to encounter the same
problems as the outgoing one. For this reason, our economic prognoses are unchanged.
• Weak national accounts data for the second quarter of 2018, particularly with regard to
agriculture and the impact of pipeline outages on oil production, has led us to revise
down our economic growth for the year from 2.2% to 2%.
The month ahead
• October 6th—APC presidential primaries: As tradition dictates, Mr Buhari as the
incumbent is highly likely to be re-selected as the APC candidate; no viable contender
has emerged ahead of the primary poll.
• October 5th-6th—PDP presidential primaries: With at least 13 prominent PDP figures
contending the nomination, the race will be very close. Whoever is chosen will have to
lead a highly fragmented party, and will lack universal backing from the rank and file. .
Major risks to our forecast Scenarios, Q2 2018 Probability Impact Intensity Nigeria re-enters recession Moderate High 12 The authorities improve respect for contracts and private property in effort to boost foreign investment Moderate High 12 The banking sector undergoes another crisis Moderate High 12 There is a military coup Low Very high 10
Mr Buhari suddenly leaves office, creating a dangerous power vacuum Moderate Moderate 9
Note: Scenarios and scores are taken from our Risk Briefing product. Risk scenarios are potential developments that might substantially change the business operating environment over the coming two years. Risk intensity is a product of probability and impact, on a 25-point scale.
Source: The Economist Intelligence Unit.
Country outlook
FROM THE ECONOMIST INTELLIGENCE UNIT
POLITICAL STABILITY: The Economist Intelligence Unit forecasts ongoing severe outbreaks of instability, given slow progress on tackling numerous security and societal challenges at a time of economic difficulty. The president, Muhammadu Buhari, is preparing for re-election in February 2019, but he is fast shedding support from within the ruling All Progressives Congress (APC), with governors and lawmakers defecting to the opposition en masse. Intraparty politics will be chaotic ahead of the poll and we ultimately expect the incumbent to lose power. The next government is likely to be led by the People’s Democratic Party (PDP, the main opposition), potentially in a coalition with smaller parties, but instability will remain an insoluble challenge. Internally, not all the ambitious politicians from the APC who have defected will be rewarded with places in the next government; or if they are, it will mean that pre-existing grandees within the PDP will have been side-lined. Whoever ends up feeling cheated will eventually turn on the new administration, as is happening to the APC now. There is also no unifying PDP presidential candidate, with around 16 aspirants competing for the nomination.
ELECTION WATCH: Presidential, legislative and state gubernatorial elections are due in 2019.
Mr Buhari intends to stand as the APC’s presidential candidate and as tradition dictates is likely be selected in primaries. However, his party will enter the election period riven by factional infighting.
A split in the APC and a wave of defections demonstrate that momentum rests with
the opposition. Most of the governors, senators and lower-house representatives who crossed the floor have joined the PDP, which is itself prone to internecine feuds (usually over leadership) and is in a particularly delicate phase ahead of primaries in October. An uneasy truce has held recently, but an influx of ambitious ex-APC politicians looking to advance their own interests stands to be a major disturbance. Even so, Mr Buhari appears weak enough for the selected PDP candidate to win power, regardless of whether they have universal backing from their party (which undoubtedly they will not).
INTERNATIONAL RELATIONS: Many of Nigeria’s militant groups operate across land and sea borders, and international co-operation will therefore be needed to tackle the threat they pose. Stretched resources, vast territories and porous borders will prevent complete military victories. Relations with the US will be mixed; the administration of Donald Trump is willing to sell Nigeria military hardware, but Mr Trump’s distaste for the trade deficit that the US runs with Nigeria (particularly due to Nigerian trade barriers on agricultural imports) could strain relations. Relations with the EU will be largely cordial but subject to tensions over the large numbers of Nigerian migrants seeking to enter Europe and Nigerian efforts to repatriate funds
in European banks that were allegedly looted by former rulers.
POLICY TRENDS: The sort of fundamental structural reforms needed to propel the economy
onto a higher growth path are unlikely during the forecast period. Measures to liberalise and unify foreign-exchange markets or move to more market-led pricing in the energy sector will
prove too contentious to see through. The same goes for devising and implementing land
ownership laws, despite this being at the centre of increasingly intense inter-communal
violence and an impediment to agricultural self-sufficiency. State management of scarce
resources enables politicians and other members of the political elite to direct the flow of these
resources to favour specific geo-ethnic and political constituencies (as well as for illicit
personal gain). Policymakers also fear that market reforms will push up consumer prices,
thereby stoking wider unrest at a time when the government is already struggling to maintain
political stability. Sections of the private sector that benefit from protectionist policies are also not keen on structural reform. In addition, policy development and implementation will
continue to suffer from a lack of co-ordination and poor relations between the various tiers of government. More modest improvements–for example, making it easier to start a business and pay taxes–are feasible but will not be revolutionary.
ECONOMIC GROWTH: The economy will remain mired in a low-growth cycle over 2018-22.
Political instability and ongoing policy uncertainty will slow or prevent reforms, and fiscal
constraints will hinder much-needed infrastructure development. Furthermore, investors and
local businesses will remain perturbed by the authorities’ often interventionist stance,
especially in the foreign-exchange market. Additional factors hitting investor and consumer
confidence will be a general election in 2019 and a global economic slowdown in 2020, leaving
both years the weakest in the outlook period.
INFLATION: Inflation came down relatively swiftly over the first six months of 2018, with
currency stability and a high base of comparison in 2017 both playing a role. We expect an
annual average rate of 11.6% for the year. As the naira weakens and the government beefs
up spending ahead of the elections, the headline rate will then edge up to 13.6% in 2019 and
reach 14.2% in 2020 as the currency slides even faster that year in conjunction with
deteriorating global economic conditions. From there, with only a small devaluation in 2021
and then currency stability in 2022, inflation will steadily cool to an annual average of 10.4%.
EXCHANGE RATES: We expect the multiple-exchange-rate system to persist throughout 2018-
22, with a notable differential between the official rate used for government business and the
market-determined rate applicable to investors and exporters (with various other rates inbetween).
Such a system allows the government to subsidise sectors deemed important for
economic or political reasons. Oil prices, and with them the level of hard-currency earnings,
will in large part dictate where the authorities are able to hold the official rate and what the
premium is between the official and the market rates. Political events (such as the magnitude
of instability that accompanies the 2019 election period) will also have an impact. Oil prices
will be strong enough to allow the authorities to keep the official rate stable in 2018, at
N305.6:US$1, but in 2019 the cumulative impact of political instability undermining confidence
and high inflation over the two years prior (and so real appreciation) will prompt devaluation.
In 2020, as oil prices slide and the US enters into a short, cyclical downturn, there will be a
deeper drop in the naira-US dollar exchange rate, followed by a smaller devaluation in 2021 as
prices edge upwards again and the global economy recovers. In 2022 the naira will be kept
stable against the US dollar as oil prices continue to rise, with the unit trading at an average of
N377.2:US$1 and N407.7:US$1 at the market rate.
EXTERNAL SECTOR: Recent oil price spikes are not expected to herald a return to the market
seen during the 2011-14 commodity super-cycle, and the net effect will be modest currentaccount
surpluses in 2018-22–a stark contrast to the enormous surpluses recorded during the
ViewsWire Nigeria Page 4 of 23
http://viewswire.eiu.com/index.asp?layout=oneclick&pubtype_id=1086275908&country_i… 9/17/2018
boom. There will also be little progress in terms of diversifying the country’s hydrocarbonsdominated
export base, with many Nigerian companies unable to compete internationally amid
high costs of capital, substandard infrastructure and skills gaps. Import growth will be strong
in 2018 on the back of a period of naira stability and recovering local demand, coupled with
higher commodity prices, but the rate of growth will slow thereafter as the currency
depreciates. The import bill in 2022 will also still be around 10% below the average value
recorded in 2011-14, when the oil boom and a stronger naira allowed a spending splurge.
This article was originally published on July 19th 2018.
2-year forecast table
Since the start of 2018 trade policy has become the biggest risk to our central
forecast for global economic growth. The US president, Donald Trump, is shifting his
country’s previous qualified support for free trade in a protectionist direction. On
June 15th the US confirmed that US$34bn-worth of China’s goods would be subject
to additional tariffs of 25%, with the possibility that another US$16bn-worth of
goods would be targeted after an extended period of public comment. China
responded in kind. The threat to the global economy increased when, on July 10th,
the US Trade Representative announced plans to levy tariffs of 10% on a further
US$200bn-worth of Chinese imports to the US. A resolution looks unlikely in the
short term, as discussions between the two countries have so far failed to resolve
the dispute. At the heart of the dispute between China and the US is a disagreement
over intellectual property and China’s technology transfer practices, although the US
trade team is divided on this issue, with Mr Trump also focusing on the US’s trade
deficit with China. For now, high-frequency indicators have shown little effect from
the trade dispute, and The Economist Intelligence Unit expects only a modest
macroeconomic impact. However, there is a significant risk that the dispute could
escalate to a point that would be harmful for business confidence, investment,
diplomatic ties and, ultimately, the global economy.
Furthermore, the Trump administration’s trade strategy has raised tensions with the US’s
traditional allies, threatening to upend the multilateral system. Initially, when the US
announced import tariffs on steel and aluminium in March, Canada, Mexico and the EU were
given exemptions. The exemptions were removed by the Trump administration on June 1st,
sparking a round of retaliatory tariffs from these traditional US allies. Reaffirming his approach
to the allies, Mr Trump deepened divisions in the G7 on June 8th-9th when he failed to agree
to the joint communiqué in support of a rules-based trading system. Following the withdrawals
from the Paris climate accord, the Iran nuclear deal and the Trans-Pacific Partnership, the
outcome of the G7 meeting and the related trade tensions with key US allies again
demonstrate that Mr Trump’s “America First” policies do not align with a multilateral system of
global governance.
The rest of the world is adjusting to this approach. On trade, US protectionism is incentivising
countries to develop regional trade agreements and diversify their trade partners. The
Comprehensive and Progressive Agreement for Trans-Pacific Partnership (CPTPP) will come
into effect in early 2019, after Japan became the second country to ratify the agreement, and
additional countries have expressed their interest in joining. We expect more countries to
develop trade ties with new trading partners, isolating the US economy and risking the market
share of US exporters.
Multiple threats are challenging vulnerable emerging markets
Rising uncertainty about global trade, increases in US interest rates and the strengthening US
dollar will put additional strain on vulnerable emerging markets. For example, since April
Turkey, Brazil and Argentina have experienced sharp currency depreciations. As global interest
rates gradually rise from ultra-low levels, investors are becoming less forgiving of countries
with financial, macroeconomic or political vulnerabilities. Turkey is illustrative here, given its
structural current-account deficit, necessitating large external financing needs, and the high
levels of foreign-currency denominated debt held by the private sector. Steep policy rate
increases by the central bank have been required to stem capital outflows. For now, we
believe that most emerging-market currencies will be able to weather a moderately faster
pace of monetary tightening in the US, provided that overall economic conditions remain
favourable. Despite this, we expect further short-lived periods of volatility as global markets
adjust to the gradual shift away from easy money. In this environment, we expect the number
of countries seeing their currencies come under pressure to rise over the next two years.
Geopolitical risks foreshadow greater volatility
We also note the economic risks posed by the complex and deepening tensions in the Middle
East. Various proxy conflicts between Iran and Saudi Arabia have the potential to further
destabilise the region. Mr Trump’s decision to withdraw the country from the Iran nuclear deal
is another signal that the US is inclined to offer stronger support to its traditional allies in the
region, Israel and Saudi Arabia, in the coming years. We expect regional security in the Middle
East to deteriorate following the US withdrawal. The move gives hardliners in Iran the upper
hand over their moderate counterparts, which is likely to lead to a more confrontational
foreign policy. Most worryingly, a proxy conflict between Israel and Iran in southern Syria has
a significant chance of escalating.
Heightened geopolitical risk in the Middle East increases the likelihood of volatility in global
energy markets. The rebalancing of the oil market pursued by OPEC over the past 18 months
means that geopolitical developments now have a more pronounced effect on prices. News of
the US’s withdrawal from the Iran deal sent prices above US$75/barrel for the first time since
2014. Ismail Kowsari, a senior officer in Iran’s Islamic Revolutionary Guards Corps (IRGC),
stated on June 4th that Iran would prevent other nations’ oil from being exported through the
Strait of Hormuz, should its own oil exports be blocked by US sanctions. Although we do not
expect Iran to close the Strait of Hormuz, the likelihood of this scenario unfolding will rise as
Iran’s oil exports decline in 2019-20.
The global economy will remain healthy, although vulnerable to shocks
Although the global economy is more vulnerable to shocks, our central forecast is that the
underlying fundamentals are strong enough to maintain a healthy growth rate for 2018-19.
Global growth accelerated markedly in 2017, to 3%, its fastest rate since 2011, and we expect
the same rate of growth in 2018. Global growth will decelerate in 2019, to 2.9%, owing largely
to weakness in Latin America, especially Brazil and Argentina, where political uncertainty and
market turbulence in 2018 will have a lingering effect. The global economy will continue to
follow the trends in the world’s two largest economies, China and the US. Risk has returned to
the Chinese economy as the global trade dispute combines with other concerning trends.
Financial markets have become more volatile, with domestic equity markets having fallen by
more than 20% since late January. Although investors are likely to be pricing in the risk from
China’s external environment, domestic demand is a more serious cause for concern. The
effects of tighter monetary policy, corporate deleveraging efforts and a crackdown on shadow
financing have become more apparent in the economy this year, having raised the cost and
availability of capital for both firms and consumers. As a result, both private consumption and
investment are softening. Although we recognise the risks, we believe that the Chinese
economy will weather these challenges, and continue to expect growth in China to slow in
2019.
The US economy continues to strengthen. Some 213,000 new jobs were created in June—the
third month this year that employment has increased by more than 200,000. The
unemployment rate increased to 4%, from 3.8%, but this reflected a rise in the labour force of
ViewsWire Nigeria Page 6 of 23
http://viewswire.eiu.com/index.asp?layout=oneclick&pubtype_id=1086275908&country_i… 9/17/2018
601,000, as sustained economic growth attracts previously disengaged workers. We continue
to expect a business-cycle downturn in the US in 2020. Capacity constraints will emerge in the
economy in the second half of 2019, pushing up inflation and forcing the Federal Reserve
(Fed, the US central bank) to signal a faster pace of interest-rate increases. This acceleration
will be sufficient to trigger a short-lived decline in private consumption and investment in early
2020. Our core forecast is that the dip will be shallow and the rebound relatively rapid, owing
to the Fed cutting interest rates aggressively in response. Slowing growth in the world’s two
largest economies means that global growth will moderate to 2.3% in that year. As the US
recovers, the global economy will receive some support in 2021-22, enabling an acceleration
to annual average growth of 2.8%.
Global monetary conditions will tighten
Among developed markets we expect falling unemployment and slowly building inflation to
push central banks towards monetary tightening. In the US, the Fed, having first raised rates
in December 2015 following the global financial crisis, will increase rates three times this year
and four times in 2019. The European Central Bank, responding to the entrenched economic
growth in the EU, is set to end the tapering of its quantitative easing (QE) programme in
2018. The Bank of Japan (the central bank) will also begin to wean itself off QE in 2019. By
the second half of that year the shift to tighter monetary policy will begin to dampen private
consumption growth in many developed markets, as borrowing will become more expensive.
Consequently, the period between mid-2017 and mid-2018—where growth has been strong,
inflation benign and monetary policy still loose—may feel like the sweetest spot for the global
economy in the current business cycle.
World economy: Forecast summary
2013 2014 2015 2016 2017 2018 2019 2020 2021 2022
Real GDP growth (%)
World (PPPa
exchange rates) 3.4 3.6 3.4 3.2 3.7 3.8 3.8 3.4 3.7 3.7
World (market exchange rates) 2.4 2.8 2.8 2.3 3.0 3.0 2.9 2.3 2.8 2.8
US 1.7 2.6 2.9 1.5 2.3 2.7 2.5 0.8 1.8 1.8
Euro area -0.2 1.4 2.0 1.8 2.6 2.1 1.8 1.6 1.7 1.7
Europe 0.8 1.9 2.0 1.8 2.7 2.2 2.0 1.8 2.0 2.0
China 7.8 7.3 6.9 6.7 6.9 6.7 6.4 6.3 5.5 5.3
Asia and Australasia 4.6 4.1 4.3 4.1 4.5 4.5 4.4 4.0 4.2 4.2
Latin America 2.8 1.4 0.5 -0.5 1.2 1.5 2.3 2.4 2.8 2.9
Middle East & Africa 2.1 2.8 2.5 4.2 1.7 2.2 2.8 3.0 3.5 3.8
Sub-Saharan Africa 4.7 4.5 3.0 1.1 2.6 2.9 3.0 2.9 3.6 3.9
World inflation (%; av) 3.9 3.5 3.2 3.8 4.5 6.0 5.1 3.3 3.3 3.4
World trade growth (%) 3.3 3.1 2.3 2.3 4.6 4.0 3.8 2.7 3.9 3.7
Commodities
Oil (US$/barrel; Brent) 108.9 98.9 52.4 44.0 54.4 73.6 72.5 68.0 74.8 78.0
Industrial raw materials (US$; % change) -6.8 -5.1 -15.2 -2.2 20.2 7.0 0.2 -0.4 -0.9 -0.4
Food, feedstuffs & beverages (US$; % change) -7.4 -5.2 -18.7 -3.5 -0.9 3.1 0.5 3.4 0.5 2.8
Exchange rates (av)
¥:US$ 97.6 105.9 121.0 108.8 112.1 108.6 106.8 104.1 100.0 98.3
US$:€ 1.33 1.33 1.11 1.11 1.13 1.20 1.19 1.21 1.21 1.24
a
Purchasing power parity.
Source: The Economist Intelligence Unit.
Top
previous | next
This article was originally published on September 6th 2018.
ViewsWire Nigeria Page 7 of 23
http://viewswire.eiu.com/index.asp?layout=oneclick&pubtype_id=1086275908&country_i… 9/17/2018
Business outlook
Value of indexa Global rankb Regional rankc
2013-17 2018-22 2013-17 2018-22 2013-17 2018-22
4.24 4.47 74 77 12 14
a
Out of 10. b
Out of 82 countries. c
Out of 17 countries: Algeria, Bahrain, Egypt, Iran, Israel, Jordan, Kuwait, Libya,
Morocco, Qatar, Saudi Arabia, Tunisia, UAE, Angola, Kenya, Nigeria and South Africa.
Download the numbers in Excel
• The business environment in Nigeria is expected to deteriorate in relative terms as the
administration struggles with the reform process and other countries make more
significant improvements.
Top
previous | next
This article was originally published on May 22nd 2018.
Economy: Market opportunities
2017 2018 2019 2020 2021 2022
Population (m) 190.9 195.9 201.0 206.2 211.4 216.8
GDP (US$ bn at market exchange rates) 376.4 428.9 429.9 459.5 514.8 561.8
GDP per head (US$ at market exchange rates) 1,972 2,190 2,139 2,229 2,435 2,591
GDP (US$ bn at PPP) 1,118.8 1,166.6 1,209.3 1,244.7 1,296.5 1,354.5
GDP per head (US$ at PPP) 5,861 5,956 6,017 6,038 6,131 6,246
Household consumption (US$ bn) 309.2 340.4 343.2 368.4 411.7 447.0
Household consumption per head (US$) 1,620 1,740 1,710 1,790 1,950 2,060
Exports of goods & services (% change) 1.9 5.8 3.1 2.2 3.3 3.5
Imports of goods & services (% change) -0.4 13.0 2.2 1.6 4.1 3.5
Download the numbers in Excel
Market potential is high, but the operating context will be unfavourable
With Africa’s largest economy (or second largest, depending on the exchange rate used) and
highest population, Nigeria will grow in importance as a market for many multinationals.
However, its attractiveness over the next five years should not be overstated. Extremely low
income levels for the majority of the population will continue to mean that most people have
little to spend on goods other than basic necessities. Furthermore, GDP per head in US dollar
terms (at market exchange rates) will remain well below the peak reached in 2014 throughout
the forecast period. This is due to the weaker context for the vital oil sector and expected
further falls in the value of the currency, the naira. Never-theless, Nigeria’s growing middle
class and wealthy elite—the sizes of which dwarf those in most other African countries—will
remain important markets. Nigeria is potentially a profitable market for multinational
companies that know how to operate in its complex and chaotic regulatory environment and
have over-come the logistical difficulties posed by the almost non-existent infrastructure, for
example by providing their own (expensive) power and water supplies.
As the problems associated with working in Nigeria substantially push up the cost of
operations (particularly given low productivity), competition from low-cost imports will remain
an issue. Providing goods through imports may seem a more attractive option for many
companies seeking to exploit the market. However, given the authorities’ desire for control
over the exchange rate, capital controls and import restrictions will continue to impede
business operations.
Top
This article was originally published on May 22nd 2018.
Economy: Long-term outlook
2018-30 2031-50 2018-50
Population and labour force (% change; annual av)
Total population 2.53 2.23 2.35
Working-age population 3.17 2.62 2.83
Working-age minus total population 0.43 0.38 0.39
Labour force 3.11 2.72 2.87
Growth and productivity (% change; annual av)
Growth of real GDP per head 0.6 2.5 1.7
Growth of real GDP 3.1 4.8 4.1
Labour productivity growth 0.0 2.0 1.2
Growth of capital stock 5.2 4.6 4.8
Total factor productivity growth -0.8 1.4 0.5
Download the numbers in Excel
Initial conditions: Although the oil sector of the economy accounts for less than 10% of GDP
(and did so even before the end of the oil price boom), its performance has a major bearing
on overall economic conditions, given its domination of government and export revenue.
Consequently, the lower price environment since late 2014 has severely weakened the local
economy. The government’s ability to spend what oil revenue it does still earn in a way that
would benefit the majority of Nigerians is hugely constrained by the extremely weak civil
service, high levels of corruption and the requirement that a large proportion of revenue be
allocated to states, which are even less accountable than the federal government. Although
there is more dynamism in certain parts of the non-oil private sector, such as trade,
entertainment, banking and communications, a background of weak infrastructure and
decades of under-investment in healthcare and education means that the initial conditions for
the country to enter sustainable and diversified growth are poor.
Population changes bring opportunities, but also threats
Demographic trends: One factor in Nigeria’s favour is its large and young population.
However, most indicators of the health of the population are low, reflecting decades of
underinvestment in healthcare facilities, which will take years to turn around even if the
commitment is found. Increasing urbanisation will also put strain on service provision in the
cities, as well as housing. An additional problem for the government is provision of education
and training facilities for the rapidly growing population, as well as long-term employment
opportunities. Internal migration, as Nigerians search for jobs in the urban centres and climate
change and environmental degradation put strain on natural resources, will add to population
pressures. Access to land is already a major driver of unrest in central Nigeria, and this
phenomenon is only likely to intensify in the coming years. Overall, it is difficult to be
optimistic about the outlook without a substantial improvement in economic governance and
policy implementation. There is time to turn the situation around over the timeframe to 2050,
but the precedent is not positive.
External conditions: There has been a structural shift in Nigeria’s export markets in recent
years, away from the US, which is steadily reducing its oil imports, and towards Asia,
particularly India. Oil reserves will not be exhausted by 2050 but are likely to have peaked by
then, which will present the additional challenge of finding external markets for the growing
non-oil economy. The importance of Nigeria, due to its size and influence on the African
continent, means that the international community will retain an interest in political
developments in the country and will try to address the issues of insecurity, corruption and
poverty. However, Nigeria’s oil and gas revenue means that the international community will
have limited influence. Without real commitment from the domestic leadership, Western
countries will promote largely cosmetic changes rather than more fundamental reforms.
ViewsWire Nigeria Page 9 of 23
http://viewswire.eiu.com/index.asp?layout=oneclick&pubtype_id=1086275908&country_i… 9/17/2018
Institutions and policy trends: The real challenge for successive governments is to raise
average incomes and living standards through a sustained period of economic reform and to
deliver a real improvement in governance. However, the omens are not good. Nigeria remains
one of the most corrupt and poorly governed countries in Sub-Saharan Africa, and given how
ingrained these problems are, they will be hard to resolve, even in a long-term timeframe. The
gap between economic policy rhetoric and implementation will remain huge, and
improvements will continue to be slow, given that the vast range of vested interests that
benefit from the chaotic status quo remain opposed to change. In addition, policy formulation
will continue to be hampered by the country’s federal structure; even if a positive reform
agenda is promoted at the national level, it is often not implemented or is openly contradicted
at the state level.
Long-term performance: Nigeria’s long-term economic performance will pick up during 2020-
50, albeit at a slower pace in 2018-30 than in 2031-50, given the long-term nature of many of
the challenges restricting the country’s economic potential. Indeed, growth in real GDP per
head will remain below 1% per year in real terms during 2018-30, given the weak mediumterm
context. Although some non-oil sectors will perform well (agriculture has enormous
potential, as do retail and communi-cations), others, such as manufacturing, are likely to
struggle to become internationally competitive. Income levels will remain low. Moreover,
Nigeria’s exports and government revenue will continue to be dominated by the hydrocarbons
sector. Once the next wave of new develop-ments in the offshore oil and gas sector has run its
course, Nigeria will face difficult choices in terms of economic development, and it remains
unclear whether fundamental policy decisions can be made and implemented to ensure that
the country is able to enter a longer period of sustained and more diversified growth.
Income and market size
2017 2030 2050
Income and market size
Population (m) 190.9 264.1 410.6
GDP (US$ bn at market exchange rates) 376 761 2,917
GDP per head (US$ at market exchange rates) 1,970 2,880 7,100
Private consumption (US$ bn) 309 529 2,195
Private consumption per head (US$) 1,620 2,000 5,350
GDP (US$ bn at PPP) 1,119 2,043 7,457
GDP per head (US$ at PPP) 5,860 7,740 18,160
Exports of goods & services (US$ bn) 45 98 411
Imports of goods & services (US$ bn) 48 54 375
Memorandum items
GDP per head (at PPP; index, US=100) 9.9 9.1 12.3
Share of world population (%) 2.57 3.20 4.44
Share of world GDP (% at market exchange rates) 0.50 0.52 0.82
Share of world GDP (% at PPP) 0.94 0.93 1.45
Share of world exports of goods & services (%) 0.22 0.22 0.34
Download the numbers in Excel
Top
previous | next
This article was originally published on September 6th 2018.
ViewsWire Nigeria Page 10 of 23
http://viewswire.eiu.com/index.asp?layout=oneclick&pubtype_id=1086275908&country_i… 9/17/2018
Economic structure
This article was originally published on September 6th 2018.
Political structure
Official name
Federal Republic of Nigeria
Form of state
Federal republic, comprising 36 states and the Federal Capital Territory (FCT, Abuja)
Legal system
Based on English common law
National legislature
National Assembly, comprising the 109-seat Senate and the 360-seat House of
Representatives; both are elected by universal suffrage for four-year terms
National elections
Most recent legislative and presidential elections were held in March 2015; the opposition
candidate, Muhammadu Buhari, was elected to the presidency, and his party, the All
Progressives Congress, took control of the National Assembly; next national elections are
scheduled for 2019
Head of state
President, elected by universal suffrage to serve a four-year term
State government
State governors and state houses of assembly
National government
Federal Executive Council, which is chaired by the president
Main political parties
The All Progressives Congress (APC), a merger between the All Nigeria People’s Party (ANPP),
the All Progressives Grand Alliance (APGA) and the Congress for Progressive Change (CPC);
the People’s Democratic Party, which ruled from 1999 until its defeat by the APC in 2015
Key ministers
President & petroleum: Muhammadu Buhari
Vice-president: Yemi Osinbajo
Agriculture & rural development: Audu Ogbeh
Budget & national planning: Udo Udoma
Defence: Manir Dan-Ali
Education: Adamu Adamu
Environment: Amina Mohammed
Finance: Kemi Adeosun
Foreign affairs: Gregory Onyeama
Health: Isaac Adewole
Information: Lai Mohammed
ViewsWire Nigeria Page 13 of 23
http://viewswire.eiu.com/index.asp?layout=oneclick&pubtype_id=1086275908&country_i… 9/17/2018
Interior: Abdulrahman Dambazau
Justice: Abubakar Malami
Labour & employment: Chris Ngige
Niger Delta: Usani Uguru
Power, works & housing: Babatunde Fashola
Solid minerals: Kayode Fayemi
Trade, investment & industry: Okechukwu Enelamah
Transport: Rotimi Amaechi
Youth & sports: Solomon Dalong
Central bank governor
Godwin Emefiele
This article was originally published on September 6th 2018.
5-year forecast table
Global outlook
2013a 2014a 2015a 2016a 2017b 2018c 2019c 2020c 2021c 2022c
International assumptions (%)
World GDP growth 2.4 2.8 2.8 2.3 3.0 3.0 2.8 2.4 2.7 2.8
EU28 GDP growth 0.3 1.8 2.2 1.9 2.6 2.1 1.8 1.7 1.8 1.9
Sub-Saharan Africa growth 4.7 4.5 3.0 1.1 2.4 3.0 3.0 2.9 3.6 3.9
World trade growth 3.3 3.1 2.2 2.3 5.3 4.0 3.7 3.0 3.9 3.7
US CPI 1.5 1.6 0.1 1.3 2.1a 2.5 2.4 1.6 1.8 1.9
EU28 CPI 1.5 0.5 0.0 0.3 1.7 1.8 1.8 1.8 1.8 1.9
Manufactures export prices -0.3 0.0 -4.5 -2.2 2.0 7.6 3.4 2.2 3.8 3.2
Oil price (Brent; US$/b) 108.9 98.9 52.4 44.0 54.4a 73.5 72.5 70.0 74.8 77.3
€ 3-month rate 0.2 0.2 0.0 -0.3 -0.3a -0.2 -0.1 0.4 0.9 1.4
US$:€ (av) 1.33 1.33 1.11 1.11 1.13a 1.18 1.19 1.21 1.21 1.24
¥:€ (av) 129.58 140.67 134.28 120.35 126.63a 128.42 126.77 126.16 120.75 121.58
a
Actual. b
Economist Intelligence Unit estimates. c
Economist Intelligence Unit forecasts.
Download the numbers in Excel
This article was originally published on September 6th 2018.
5-year forecast table
Gross domestic product, current market prices
2013a 2014a 2015a 2016a 2017b 2018c 2019c 2020c 2021c 2022c
Expenditure on GDP (N bn at current market prices)
GDPd 81,010 90,137 95,178 102,575 114,907a 137,857 154,440 175,181 200,692 226,389
Private consumption 59,048 64,671 74,786 83,635 95,056 107,983 122,453 139,352 158,861 179,354
Government consumption 5,796 5,827 5,649 5,523 6,692 7,763 9,277 10,986 12,668 14,536
Gross fixed investment 11,478 13,596 14,112 15,104 16,266 18,525 20,627 23,552 26,970 31,002
Exports of goods &
services 14,622 16,617 10,152 9,456 14,709 20,518 21,665 24,320 28,601 30,990
Imports of goods &
services 10,530 11,222 10,152 11,801 15,316 17,920 20,817 24,573 28,336 31,904
Domestic demand 76,918 84,742 95,178 104,921 118,804 135,259 153,592 175,433 200,427 227,303
Expenditure on GDP (US$ bn at current market prices)
GDP 515.0 568.5 493.8 405.4 376.4a 451.6 488.8 492.8 532.6 600.2
Private consumption 375.4 407.9 388.0 330.6 311.4 353.7 387.6 392.0 421.6 475.5
Government consumption 36.8 36.8 29.3 21.8 21.9 25.4 29.4 30.9 33.6 38.5
Gross fixed investment 73.0 85.7 73.2 59.7 53.3 60.7 65.3 66.3 71.6 82.2
Exports of goods &
services 93.0 104.8 52.7 37.4 48.2 67.2 68.6 68.4 75.9 82.2
Imports of goods &
services 66.9 70.8 52.7 46.6 50.2 58.7 65.9 69.1 75.2 84.6
Domestic demand 489.0 534.5 493.8 414.7 389.2 443.1 486.1 493.5 531.9 602.7
Economic structure (% of GDP at current market prices)
Private consumption 72.9 71.7 78.6 81.5 82.7 78.3 79.3 79.5 79.2 79.2
Government consumption 7.2 6.5 5.9 5.4 5.8 5.6 6.0 6.3 6.3 6.4
Gross fixed investment 14.2 15.1 14.8 14.7 14.2 13.4 13.4 13.4 13.4 13.7
Exports of goods &
services 18.0 18.4 10.7 9.2 12.8 14.9 14.0 13.9 14.3 13.7
Imports of goods &
services 13.0 12.5 10.7 11.5 13.3 13.0 13.5 14.0 14.1 14.1
Memorandum item
Oil production (‘000 b/d) 1,953 1,898 1,804 1,531 1,525 1,630 1,687 1,716 1,777 1,851
a
Actual. b
Economist Intelligence Unit estimates. c
Economist Intelligence Unit forecasts. d
Components may not sum
to total due to a statistical discrepancy.
This article was originally published on September 6th 2018.
5-year forecast table
Gross domestic product, at constant prices
2013a 2014a 2015a 2016a 2017b 2018c 2019c 2020c 2021c 2022c
Real expenditure on GDP (N bn at constant 2010 market prices)
GDP 63,943 67,977 69,781 68,652 69,212a 70,825 72,199 73,767 75,745 77,978
Private consumption 43,048 43,312 43,942 41,424 41,030 41,747 42,422 43,039 43,999 45,111
Government consumption 4,445 4,133 3,641 3,091 2,844 2,955 3,109 3,224 3,327 3,457
Gross fixed investment 9,320 10,572 10,432 9,927 9,632 9,882 10,188 10,576 11,009 11,505
Exports of goods & services 13,301 16,505 16,520 18,425 20,035 20,774 21,339 21,972 22,663 23,445
Imports of goods & services 6,694 7,094 5,272 4,726 4,950 5,065 5,402 5,596 5,817 6,115
Domestic demand 57,335 58,566 58,533 54,954 54,121 55,116 56,262 57,392 58,899 60,648
Real expenditure on GDP (% change)
GDP 5.4 6.3 2.7 -1.6 0.8a 2.3 1.9 2.2 2.7 2.9
Private consumption 21.1 0.6 1.5 -5.7 -1.0 1.7 1.6 1.5 2.2 2.5
Government consumption -10.3 -7.0 -11.9 -15.1 4.0 3.9 5.2 3.7 3.2 3.9
Gross fixed investment 7.9 13.4 -1.3 -4.8 1.8 2.6 3.1 3.8 4.1 4.5
Exports of goods & services -21.7 24.1 0.1 11.5 8.7 3.7 2.7 3.0 3.1 3.5
Imports of goods & services 12.2 6.0 -25.7 -10.4 4.8 2.3 6.7 3.6 3.9 5.1
Domestic demand 15.5 2.1 -0.1 -6.1 -1.5 1.8 2.1 2.0 2.6 3.0
Real contribution to GDP growth (% points)
Private consumption 12.3 0.4 0.9 -3.6 -0.6 1.0 1.0 0.9 1.3 1.5
Government consumption -0.8 -0.5 -0.7 -0.8 -0.4 0.2 0.2 0.2 0.1 0.2
Gross fixed investment 1.1 2.0 -0.2 -0.7 -0.4 0.4 0.4 0.5 0.6 0.7
External balance -7.3 4.4 2.7 3.5 2.0 0.9 0.3 0.6 0.6 0.6
a
Actual. b
Economist Intelligence Unit estimates. c
Economist Intelligence Unit forecasts.
Download the numbers in Excel
Top
ViewsWire Nigeria Page 15 of 23
http://viewswire.eiu.com/index.asp?layout=oneclick&pubtype_id=1086275908&country_i… 9/17/2018
previous | next
This article was originally published on September 6th 2018.
5-year forecast table
Gross domestic product by sector of origin
2013a 2014a 2015a 2016a 2017a 2018b 2019b 2020b 2021b 2022b
Origin of GDP (N bn at constant 2010 prices)
GDP at factor cost 63,219 67,153 69,024 67,931 68,497c 70,102 71,437 73,027 74,990 77,131
Agriculture 14,751 15,380 15,952 16,607 17,179 17,729 18,261 18,827 19,430 20,071
Industry 15,682 16,742 16,367 14,918 15,244 15,614 15,829 15,994 16,323 16,685
Services 32,786 35,030 36,705 36,406 36,073 36,759 37,347 38,206 39,237 40,375
Origin of GDP (real % change)
Agriculture 2.9 4.3 3.7 4.1 3.4 3.2 3.0 3.1 3.2 3.3
Industry 2.2 6.8 -2.2 -8.9 2.2 2.4 1.4 1.0 2.1 2.2
Services 8.4 6.8 4.8 -0.8 -0.9 1.9 1.6 2.3 2.7 2.9
Origin of GDP (% of factor cost GDP)
Agriculture 21.0 20.2 20.9 21.2 21.1c 21.2 21.5 21.7 21.8 21.8
Industry 26.0 24.9 20.4 18.4 22.5c 22.6 22.4 22.2 22.1 21.9
Services 53.0 54.8 58.8 60.4 56.4c 56.2 56.1 56.1 56.2 56.3
Memorandum item
Industrial production (% change) -0.2 5.9 -3.5 -9.4c 1.9c 3.4 2.4 2.0 3.1 3.2
a
Actual. b
Economist Intelligence Unit forecasts. c
Economist Intelligence Unit estimates.
Download the numbers in Excel
Top
previous | next
This article was originally published on September 6th 2018.
5-year forecast table
Growth and productivity
2013a 2014a 2015a 2016a 2017a 2018b 2019b 2020b 2021b 2022b
Growth and productivity (%)
Labour productivity growth 2.5 4.4 -0.4 -1.5 -2.0 -0.5 -0.3 -0.8 -0.5 -0.4
Total factor productivity growth 1.2 2.0 -1.0 -2.6 -1.7 -0.1 0.0 -0.3 0.1 0.2
Growth of capital stock 8.3 9.1 7.5 5.9 4.8 4.5 4.4 4.3 4.3 4.3
Growth of potential GDP 5.9 6.9 3.5 1.3 1.8 5.2 2.9 3.3 3.6 3.7
Growth of real GDP 5.4c 6.3c 2.7c -1.6c 0.8c 2.3 1.9 2.2 2.7 2.9
Growth of real GDP per head 2.6 3.5 0.0c -4.2c -1.8 -0.3 -0.6 -0.4 0.1 0.4
a
Economist Intelligence Unit estimates. b
Economist Intelligence Unit forecasts. c
Actual.
Download the numbers in Excel
Top
previous | next
This article was originally published on September 6th 2018.
5-year forecast table
Economic structure, income and market size
2013a 2014a 2015a 2016a 2017b 2018c 2019c 2020c 2021c 2022c
Population, income and market size
Population (m) 171.8 176.5 181.2 186.0 190.9 195.9 201.0 206.2 211.4 216.8
GDP (US$ bn at market exchange rates) 515 568 494 405 376a 452 489 493 533 600
GDP per head (US$ at market exchange rates) 2,997 3,222 2,726 2,180 1,972 2,305 2,432 2,391 2,519 2,768
Private consumption (US$ bn) 375 408 388 331 311 354 388 392 422 476
ViewsWire Nigeria Page 16 of 23
http://viewswire.eiu.com/index.asp?layout=oneclick&pubtype_id=1086275908&country_i… 9/17/2018
Private consumption per head (US$) 2,184 2,311 2,142 1,777b 1,631 1,806 1,929 1,902 1,994 2,193
GDP (US$ bn at PPP) 974 1,054 1,094 1,090 1,119 1,165 1,212 1,247 1,297 1,356
GDP per head (US$ at PPP) 5,670 5,980 6,040 5,860b 5,860 5,950 6,030 6,050 6,130 6,260
Memorandum item
Share of world exports of goods (%) 0.52 0.45 0.28 0.22 0.26a 0.31 0.31 0.29 0.31 0.32
a
Actual. b
Economist Intelligence Unit estimates. c
Economist Intelligence Unit forecasts.
Download the numbers in Excel
Top
previous | next
This article was originally published on September 6th 2018.
5-year forecast table
Fiscal indicators
2013a 2014a 2015a 2016a 2017b 2018c 2019c 2020c 2021c 2022c
Fiscal indicators (% of GDP)
Government expenditure 6.4 5.0 4.8 5.2 5.2 5.5 5.5 5.3 5.3 5.2
Government revenue 5.0 4.1 3.7 3.1 3.4 3.5 3.5 3.4 3.7 3.9
Budget balance -1.4 -0.9 -1.1 -2.1 -1.8 -2.0 -2.1 -1.9 -1.5 -1.3
Government debt 10.4 10.5 11.5 14.2 16.0 16.5 18.0 18.8 18.8 18.7
a
Actual. b
Economist Intelligence Unit estimates. c
Economist Intelligence Unit forecasts.
Download the numbers in Excel
Top
previous | next
This article was originally published on September 6th 2018.
5-year forecast table
Monetary indicators
2013a 2014a 2015a 2016a 2017a 2018b 2019b 2020b 2021b 2022b
Monetary indicators
Exchange rate N:US$ (av) 157.3 158.6 192.7 253.0 305.3 305.3 316.0 355.5 376.8 377.2
Exchange rate N:US$ (year-end) 157.3 169.7 196.5 304.5 305.5 305.3 319.7 366.1 377.0 377.3
Exchange rate N:€ (av) 208.93 210.69 213.86 279.97 344.76 361.12 375.20 430.99 454.96 466.73
Exchange rate N:€ (year-end) 216.88 206.01 213.93 320.97 366.39 352.61 388.44 439.34 461.79 471.68
Real effective exchange rate, CPI-based (av) 50.95c 54.48c 53.59c 47.07c 44.08c 47.11 50.85 50.22 51.76 55.39
Purchasing power parity N:US$ (av) 83.15 85.49 87.00 94.10 102.71 118.29 127.44 140.50 154.75 166.90
Money supply (M2) growth (%) 1.3 20.5 5.9 17.8 1.7 9.6 4.1 6.4 7.0 4.0
Domestic credit growth (%) 14.5 32.6 12.1 24.3 -3.7 12.9 9.2 9.6 9.8 8.6
Commercial banks’ prime rate (av; %) 16.7 16.5 16.8 16.9 17.6 16.8 17.0 16.1 15.5 14.5
Deposit rate (av; %) 7.9 9.3 9.1 7.5 9.6 8.5 8.7 8.0 8.0 8.0
Money-market rate (av; %) 10.8 10.5 9.4 10.1 13.5c 10.3 13.8 11.0 9.7 9.8
a
Actual. b
Economist Intelligence Unit forecasts. c
Economist Intelligence Unit estimates.
Download the numbers in Excel
Top
previous | next
This article was originally published on September 6th 2018.
ViewsWire Nigeria Page 17 of 23
http://viewswire.eiu.com/index.asp?layout=oneclick&pubtype_id=1086275908&country_i… 9/17/2018
5-year forecast table
Employment, wages and prices
2013a 2014b 2015a 2016a 2017b 2018c 2019c 2020c 2021c 2022c
The labour market (av)
Labour force (m) 52.8 54.3a 55.8 57.4 59.0 62.3 63.7 65.7 67.7 69.7
Labour force (% change) 2.7 2.7a 2.8 2.8 2.8 5.6 2.2 3.2 3.1 3.1
Wage and price inflation (%)
Consumer prices (av) 8.5 8.0a 9.0 15.7 16.5a 11.6 13.6 14.2 11.7 10.4
Consumer prices (year-end) 7.9 8.0a 9.6 18.6 15.3a 9.2 13.8 11.9 11.0 9.9
GDP deflator (av) 5.9 4.7a 2.9 9.5 11.1 17.2 9.9 11.0 11.6 9.6
Private consumption deflator (av) 15.0 8.9 14.0 18.6 14.7 11.6 11.6 12.2 11.5 10.1
Government consumption deflator (av) 8.5 8.1 10.0 15.2 31.7 11.6 13.6 14.2 11.7 10.4
Fixed investment deflator (av) 3.5b 4.4 5.2 12.5 11.0 11.0 8.0 10.0 10.0 10.0
Average nominal wages 10.7 10.2 11.2b 18.0b 18.8 11.8 12.2 11.8 11.8 10.5
Average real wages 2.0b 2.0 2.0b 2.0b 2.0 0.1 -1.2 -2.1 0.1 0.1
Unit labour costs (N-based; av) 10.7b 10.2 11.2b 18.0b 18.8 13.0 12.2 11.8 11.8 10.5
Unit labour costs (US$-based) 10.8b 9.3 -8.5b -10.1b -1.5 13.0 8.4 -0.6 5.5 10.4
a
Actual. b
Economist Intelligence Unit estimates. c
Economist Intelligence Unit forecasts.
Download the numbers in Excel
Top
previous | next
This article was originally published on September 6th 2018.
5-year forecast table
Current account and terms of trade
2013a 2014a 2015a 2016a 2017a 2018b 2019b 2020b 2021b 2022b
Current account (US$ bn)
Current-account balance 20.1 1.3 -15.4 2.7 10.4 20.3 19.1 14.7 16.3 18.4
Current-account balance (% of GDP) 3.9 0.2 -3.1 0.7 2.8 4.5 3.9 3.0 3.1 3.1
Goods: exports fob 95.1 82.6 45.9 34.7 45.8 60.4 62.1 61.9 68.1 73.7
Goods: imports fob -51.4 -61.6 -52.3 -35.2 -32.7 -38.6 -41.8 -43.9 -47.8 -52.0
Trade balance 43.8 21.0 -6.4 -0.5 13.1 21.8 20.3 18.0 20.3 21.7
Services: credit 2.4 2.0 3.2 3.7 5.0 5.7 6.1 6.4 7.0 7.8
Services: debit -22.5 -24.5 -19.6 -11.8 -18.3 -21.6 -23.5 -23.7 -26.1 -28.8
Services balance -20.1 -22.5 -16.5 -8.0 -13.2 -15.9 -17.4 -17.3 -19.1 -21.0
Primary income: credit 0.9 1.6 0.9 1.3 1.6 2.3 2.7 2.6 2.6 2.7
Primary income: debit -26.6 -20.8 -13.6 -9.9 -13.1 -14.3 -15.0 -14.9 -16.5 -18.3
Primary income balance -25.7 -19.2 -12.7 -8.6 -11.5 -12.1 -12.3 -12.3 -13.9 -15.6
Secondary income: credit 22.7 22.8 22.1 20.9 22.5 27.0 29.2 27.0 29.7 34.1
Secondary income: debit -0.5 -0.9 -1.9 -1.1 -0.5 -0.6 -0.7 -0.7 -0.7 -0.8
Secondary income balance 22.2 21.9 20.2 19.9 22.0 26.4 28.6 26.3 29.0 33.3
Terms of trade
Export price index (US$-based; 2005=100) 105.0c 95.4c 47.9c 30.5c 36.4c 49.4 48.8 47.2 50.9 53.1
Export prices (% change) -18.0c -9.1c -49.8c -36.4c 19.6c 35.5 -1.1 -3.3 7.6 4.4
Import price index (US$-based; 2005=100) 150.3c 150.0c 150.2c 148.3c 158.7c 184.5 188.2 190.1 197.7 205.3
Import prices (% change) 0.0c -0.2c 0.1c -1.2c 7.0c 16.3 2.0 1.0 4.0 3.9
Terms of trade (2005=100) 69.9c 63.6c 31.9c 20.6c 23.0c 26.8 26.0 24.9 25.7 25.9
Memorandum item
Export market growth (%) -0.4c 3.9c 3.0c 1.6c 5.9c 4.0 3.7 1.7 3.8 4.0
a
Actual. b
Economist Intelligence Unit forecasts. c
Economist Intelligence Unit estimates.
Download the numbers in Excel
Top
previous | next
This article was originally published on September 6th 2018.
ViewsWire Nigeria Page 18 of 23
http://viewswire.eiu.com/index.asp?layout=oneclick&pubtype_id=1086275908&country_i… 9/17/2018
5-year forecast table
Foreign direct investment
2013a 2014a 2015a 2016a 2017a 2018b 2019b 2020b 2021b 2022b
Foreign direct investment (US$ bn)
Inward direct investment 5.61 4.69 3.06 4.45 3.50 3.79 3.03 3.18 4.11 5.30
Inward direct investment (% of GDP) 1.1 0.8 0.6 1.1 0.9 0.8 0.6 0.6 0.8 0.9
Inward direct investment (% of gross fixed investment) 7.7 5.5 4.2 7.5 6.6 6.2 4.6 4.8 5.7 6.4
Outward direct investment -1.2 -1.6 -1.4 -1.3 -1.3 -1.4 -1.5 -1.7 -1.8 -2.0
Net foreign direct investment 4.4 3.1 1.6 3.1 2.2 2.4 1.5 1.5 2.3 3.3
Stock of foreign direct investment 81.3 92.8 91.5 113.4 116.9 120.7 123.7 126.9 131.0 136.3
Stock of foreign direct investment per head (US$) 473.0 525.6 505.0 609.5 612.2 616.0 615.5 615.4 619.4 628.4
Stock of foreign direct investment (% of GDP) 15.8 16.3 18.5 28.0 31.0 26.7 25.3 25.7 24.6 22.7
Memorandum items
Share of world inward direct investment flows (%) 0.22 0.25 0.11 0.19 0.21 0.17 0.13 0.13 0.16 0.20
Share of world inward direct investment stock (%) 0.35 0.38 0.35 0.40 0.39c 0.38 0.36 0.36 0.36 0.36
a
Actual. b
Economist Intelligence Unit forecasts. c
Economist Intelligence Unit estimates.
Download the numbers in Excel
Top
previous | next
This article was originally published on September 6th 2018.
5-year forecast table
External debt
2013a 2014a 2015a 2016a 2017b 2018c 2019c 2020c 2021c 2022c
External debt
Total external debt (US$ bn) 21.1 24.8 28.9 31.2 41.0 47.3 49.4 53.1 56.3 60.0
Total external debt (% of GDP) 4.1 4.4 5.9 7.7 10.9 10.5 10.1 10.8 10.6 10.0
Debt/exports ratio (%) 17.7 23.1 40.7 53.1 58.2 52.6 52.4 57.4 55.5 53.8
Debt-service ratio, paid (%) 0.4 4.2 2.1 4.3 3.8 4.2 4.4 4.7 5.1 5.0
a
Actual. b
Economist Intelligence Unit estimates. c
Economist Intelligence Unit forecasts.
Download the numbers in Excel
Top
previous | next
This article was originally published on September 6th 2018.
5-year forecast table
The sources for global and domestic data refer to historical data; the source for all forecast
data, unless otherwise stated, is The Economist Intelligence Unit
Global data
US and OECD GDP growth: OECD
World trade growth: Economist Intelligence Unit aggregate
US and OECD consumer price inflation: OECD
Oil prices: IEA average import price
Non-oil commodity prices: IFS
ViewsWire Nigeria Page 19 of 23
http://viewswire.eiu.com/index.asp?layout=oneclick&pubtype_id=1086275908&country_i… 9/17/2018
Manufactures prices: UN, Monthly Bulletin of Statistics
US$ 3-month commercial paper rate: IFS
€ 3-month interbank rate: IFS
Domestic data
Population: UN
Trade by country: IMF, Direction of Trade Statistics
Balance of payments: IFS and CBN, Annual Report and Statement of Accounts
Inflation: IFS, CBN and Federal Office of Statistics
Exchange rate: IFS; principal rate expressed as naira:US dollar
Interest rate: IFS; year-end lending rate
GDP growth and expenditure breakdown: World Bank, World Tables; 1987 prices
US$ GDP: IFS; in current prices converted from local currency at annual average market
exchange rate
GDP per head: US dollar GDP divided by population
Oil production: IEA; m barrels/day
Oil price: The Economist Intelligence Unit; dated Brent Blend
FDI: IFS, UNCTAD, World Investment Report and CBN
Total external debt: sum of long- and short-term debt and IMF credits
Long-term external debt: World Bank, International Debt Statistics; year-end medium- and
long-term publicly guaranteed and non-guaranteed debt outstanding, with an original maturity
of more than one year
Short-term external debt: World Bank, International Debt Statistics; year-end debt
outstanding, with an original maturity of less than one year
IMF credits: IFS and country page on website
Total debt service: World Bank, International Debt Statistics; principal repayments made
against long-term debt, plus interest payments and IMF charges on total external debt
Debt-service ratio: ratio of total debt service paid to exports of goods and services
Interest-payments ratio: ratio of total interest paid on external debt to exports of goods and
services
Abbreviations
CBN: Central Bank of Nigeria
IEA: International Energy Agency
IFS: International Financial Statistics
IMF: International Monetary Fund
ViewsWire Nigeria Page 20 of 23
http://viewswire.eiu.com/index.asp?layout=oneclick&pubtype_id=1086275908&country_i… 9/17/2018
NPC: National Population Commission
OECD: Organisation for Economic Co-operation and Development
UNCTAD: UN Conference on Trade and Development
Top
previous | next
This article was originally published on May 22nd 2018.
Economy: Social indicators & living standards
Social indicators and living standards
2017 2022
Nigeria ME & A (av)a Nigeria ME & A (av)a
Health
Healthcare spending (% of GDP) 4.0 6.2 3.9 6.2
Healthcare spending (US$ per head) 80 320 100 403
Infant mortality rate (per 1,000 live births) 69.8 44.6 62.3 39.2
Food and beverages
Food, beverages & tobacco (% of household spending) 52.8 38.9 52.7 35.3
Meat consumption (kg per person) 9.1 29.6 9.0 30.5
Milk consumption (litres per person) 8.0 39.8 8.4 41.7
Coffee & tea consumption (kg per person) 0.0 1.1 0.0 1.1
Consumer goods in use (per 1,000 population)
Passenger cars 18 63 22 70
Telephone main lines 0 54 0 46
Mobile phone subscribers 0 1,096 0 1,241
Personal computers 0 230 0 317
Households
No. of households (m) 41,218 89 48,376 103
No. of people per household (av) 4.6 4.3 4.5 4.1
Income and income distribution
Average monthly wage (US$) 52.0 – 61.9 –
Gini index 43.0b 43.0b – –
Sources: UN Statistical Office; World Bank; Food and Agriculture Organisation (FAO); Euromonitor; World Health
Organisation (WHO); national statistical offices; Pyramid Research; Economist Intelligence Unit estimates and
forecasts.
Download the numbers in Excel
Top
previous | next
This article was originally published on September 6th 2018.
Quarterly economic indicators
2016 2017 2018
3 Qtr 4 Qtr 1 Qtr 2 Qtr 3 Qtr 4 Qtr 1 Qtr 2 Qtr
Prices
Consumer prices (2005=100) 206.2 211.5 219.1 230.3 239.2 244.8 250.4 257.4
Consumer prices (% change, year on year) 17.5 18.5 17.9 16.5 16.0 15.7 14.3 11.8
Financial indicators
Exchange rate N:US$ (av) 302.7 304.7 305.1 305.3 305.3 305.4 305.3 305.3
Exchange rate N:US$ (end-period) 304.8 304.5 305.9 305.4 305.3 305.5 305.2 305.3
Lending rate (av; %) 17.1 17.1 17.2 17.5 17.7 17.8 17.5 n/a
Deposit rate (av; %) 7.7 8.6 9.0 9.3 10.0 9.8 8.9 n/a
Money market rate (av; %) 13.8 14.0 13.8 13.5 13.3 13.1 8.4 n/a
M1 (end-period; N bn) 9,830 11,272 10,235 10,190 10,064 11,036 10,913 10,701
M1 (% change, year on year) 37.5 31.5 13.2 7.1 2.4 -2.1 6.6 5.0
M2 (end-period; N bn) 22,014 23,592 22,304 21,981 21,954 24,001 24,303 24,814
M2 (% change, year on year) 17.6 17.8 9.0 -0.4 -0.3 1.7 9.0 12.9
28,335 26,875 25,516 33,117 35,440 38,243 41,505 38,279
ViewsWire Nigeria Page 21 of 23
http://viewswire.eiu.com/index.asp?layout=oneclick&pubtype_id=1086275908&country_i… 9/17/2018
Stockmarket index (NSE all share; end-period; Jan
3rd 1984=100)
Stockmarket index (% change, year on year) -9.2 -6.2 0.8 11.9 25.1 42.3 62.7 15.6
Sectoral trends
Crude oil production (m barrels/day)a 1.41 1.45 1.39 1.49 1.62 1.59 1.66 n/a
Crude oil production (% change, year on year) -21.7 -20.3 -21.0 -0.4 15.1 9.7 19.1 n/a
Foreign trade (US$ m)
Exports fob 7,924 9,914 9,966 10,811 11,984 13,057 14,394 n/a
Oil 6,470 7,857 7,784 7,945 9,734 10,654 11,726 n/a
Imports cif 8,620 8,331 8,359 9,486 9,266 8,280 9,337 n/a
Trade balance -696 1,583 1,606 1,325 2,717 4,777 5,056 n/a
Foreign reserves (US$ m)
Reserves excl gold (end-period) 24,531 25,844 30,298 30,288 32,491 38,766 46,257 47,788
a
Excluding condensates.
Sources: Central Bank of Nigeria; Nigeria National Bureau of Statistics; IMF, International Financial Statistics;
Direction of Trade Statistics; International Energy Agency, Monthly Oil Market Report; Energy Intelligence Group, Oil
Market Intelligence; Bloomberg.
Download the numbers in Excel
Top
previous | next
This article was originally published on September 6th 2018.
Country facts
Annual data 2017a Historical averages (%) 2013-17
Population (m) 190.9Population growth 2.7
GDP (US$ bn; market exchange rate) 376.4b
Real GDP growth 2.7
GDP (US$ bn; purchasing power parity) 1,118.8Real domestic demand growth 1.7
GDP per head (US$; market exchange rate) 1,972Inflation 11.5
GDP per head (US$; purchasing power parity) 5,861Current-account balance (% of GDP) 1.4
Exchange rate (av) N:US$ 305.3b
FDI inflows (% of GDP) 1.0
a
Economist Intelligence Unit estimates. b
Actual.
Download the numbers in Excel
Background: Nigeria gained independence in 1960 and the army soon became the dominant
political player. Multiparty democracy was restored in 1999. That presidential poll and the next
one, in 2003, were both won by a former military ruler turned civilian politician, Olusegun
Obasanjo. Mr Obasanjo was unable to change the constitution to allow him to serve a third
term in office, so in the 2007 election power passed to his handpicked successor, Umaru
Yar’Adua. After Mr Yar’Adua’s death in May 2010, his vice-president, Goodluck Jonathan,
assumed the presidency and went on to win the 2011 presidential election. Mr Jonathan was
defeated by Muhammadu Buhari in the 2015 presidential election—the first time an incumbent
had been defeated at the ballot box and an important step forward for the country’s
democracy.
Political structure: Under the constitution adopted in May 1999, a strong executive presidency
appoints a Federal Executive Council, comprising government ministers and ministers of state
from each of Nigeria’s 36 states. The executive is accountable to the bicameral National
Assembly. Political parties tend to lack clear ideologies; in practice, personal and ethnic ties
dominate the political process. The People’s Democratic Party (Mr Jonathan’s party) had
historically been the only political party to attract nationwide support, but the merger in 2013
of three large opposition parties to form the All Progressives Congress gave them, with
Mr Buhari at the helm, the reach that they needed to take power in 2015. Although the 36
state governments enjoy significant autonomy, almost all remain dependent on the federal
government for funding.
Policy issues: Successive governments have sought to improve macroeconomic stability and
develop the nation’s dire infrastructure, with mixed results. Meanwhile, the government is
ViewsWire Nigeria Page 22 of 23
http://viewswire.eiu.com/index.asp?layout=oneclick&pubtype_id=1086275908&country_i… 9/17/2018
© 2018 The Economist Intelligence Unit Limited. All rights reserved.
About us | Privacy policy | Terms of access | Cookies | Contact us | Help
struggling to end insecurity in various parts of the country. These tensions are stoked by the
underlying problems of poverty and unemployment. Management of the naira by the
authorities is contentious, and currency liberalisation will be postponed whenever foreignexchange
supplies permit.
Taxation: Corporate profits in most non-oil sectors are taxed at 30%. Planned changes to the
tax system for the oil and gas sector have been repeatedly delayed, creating uncertainty. Most
other taxes are low, reflecting the fact that most revenue comes from the oil sector, with the
total tax take very small as a share of GDP. Tax compliance is a time-consuming process.
Foreign trade: Exports are dominated by oil. The slump in oil prices from the second half of
2014 has almost wiped out what had historically been a large current-account surplus. The
non-oil export base has been rendered globally uncompetitive by an overvalued exchange rate
and massive infrastructure deficiencies.
Major exports 2017 % of total Major imports 2012 % of total
Crude oil 80.1Machinery & transport equipment 26.4
Gas 12.6Manufactured goods 13.9
Chemicals 11.0
Leading markets 2017 % of total Leading suppliers 2017 % of total
India 32.4China 21.1
US 13.1Belgium 8.7
Spain 7.1US 8.4
China 6.1South Korea 7.5
Download PDF here: EIU report Nigeria (1)
Related
You may like
Uncategorized
APC Convention: FG Blocks Roads, Orders Workers to Operate from Home
Published
2 weeks agoon
March 27, 2026By
Eric
The Federal Government has directed civil servants working within the Federal Secretariat in Abuja to work from home on Friday, March 27, 2026, ahead of the national convention of the All Progressives Congress (APC).
The directive was contained in a circular issued and signed by Abdul Garba, Permanent Secretary, Service Welfare Office, for the Head of the Civil Service of the Federation.
According to the circular, access roads leading to and around the Federal Secretariat Complex, Phases I, II and III, will be closed from Friday, March 27, to Saturday, March 28, 2026.
“All Ministries, Extra-Ministerial Departments, Agencies and Offices located within the Federal Secretariat, Phases I, II & III are hereby informed of the closure of all access roads leading to and around the said Federal Secretariat Complex, from Friday, 27th to Saturday, 28th March, 2026,” the statement read.
The government said the decision was due to the use of Eagle Square for the APC national convention.
“This is due to the use of Eagle Square for the National Convention of the All Progressives Congress (APC) Party on the said dates,” the circular stated.
It added that workers in affected offices should stay off-site on the specified day.
“Accordingly, all personnel whose offices are located within Phases I, II and III of the Federal Secretariat Complex as well as the Ministry of Foreign Affairs, are to work from home on Friday, 27th March, 2026,” it added.
The government also directed heads of ministries, departments, and agencies to ensure compliance.
“All concerned Permanent Secretaries and Heads of Agencies are kindly requested to bring the content of this Circular to the attention of their staff, and ensure strict compliance,” the circular stated.
The directive comes as the APC prepares to hold its national convention at Eagle Square, Abuja, an event expected to bring together party leaders, delegates, and supporters from across the country.
Related
Uncategorized
Open Letter to Global Leadership: Forging New Intergenerational Partnership for Sustainable Governance
Published
4 months agoon
December 6, 2025By
Eric
By Tolulope A. Adegoke, PhD
“Sustainable governance in the 21st century requires a new operating system: one where intergenerational partnership is not an aspiration, but an engineered and mandatory feature of all decision-making.” – Tolulope A. Adegoke, PhD
Esteemed Leaders, Heads of State, and Architects of Global Policy,
As we navigate the third decade of the 21st century, our world is suspended between unparalleled technological promise and profound systemic peril. This duality defines our epoch. Yet, within this tension lies a persistent, critical flaw in our global governance model: the exclusion of youth from the formal structures of power and long-term decision-making. This letter posits that this is not merely a representational gap, but the central governance failure of our time. To secure a stable, prosperous, and equitable future, we must enact nothing less than a New Intergenerational Partnership—a binding, structural, and practical commitment to integrate youth into the very heart of political and corporate leadership. The alternative is not stagnation, but a heightened risk of repeated crises and a forfeiture of our collective potential.
Deconstructing the Crisis of Legitimacy and Innovation
Our current systems are hemorrhaging legitimacy among the young. This disillusionment stems from a recognizable pattern: short-term political cycles incentivize policies that harvest immediate rewards while deferring complex costs—ecological, financial, and social—to a future electorate that had no say in their creation. This creates a dangerous democratic deficit.
· The Foresight Deficit: Young people are not a monolithic bloc, but they are unified as the primary stakeholders in long-term outcomes. Their lived experience—from navigating precarious job markets shaped by automation to mobilizing for climate justice—grants them an intuitive, granular understanding of emerging realities. Excluding this perspective from high-level strategy results in policies that are reactive, myopic, and often obsolete upon implementation. For instance, regulatory frameworks for artificial intelligence or biotechnology crafted without the generation that will be most affected by their societal integration are inherently flawed.
· The Innovation Imperative: The challenges we face are novel and interconnected. Solving them requires cognitive diversity and a willingness to dismantle legacy paradigms. Youth bring this disruptive ingenuity. They are natural systems thinkers, adept at collaborating across digital networks and cultural boundaries. Their inclusion is not about adding a “youth perspective” as a separate item on an agenda; it is about fundamentally improving the quality of decision-making through necessary cognitive diversity. It is the difference between digitizing an old process and reimagining the system entirely.
A Bilateral Blueprint: Cultivating Capacity and Engineering Access
Bridging the intergenerational divide requires a twin-pillar strategy: one pillar dedicated to rigorous preparation, the other to guaranteed access. One without the other is insufficient.
Pillar One: The Cultivation of “Next-Gen Stewards” Through Ecosystem Reform
We must re-engineer societal institutions to build not just skilled employees, but wise, ethical, and resilient stewards capable of wielding complex responsibility.
1. Transformative Education Systems: Our educational institutions, from secondary to tertiary levels, must pivot from knowledge transmission to capacity cultivation. Core curricula should be restructured around:
o Complex Problem-Solving: Using real-world case studies on climate migration, public health, or digital ethics.
o Civic Architecture: Teaching the mechanics of governance, policy drafting, public finance, and diplomatic negotiation.
o Ethical Leadership: Embedding philosophy, mediation, and integrity frameworks into all disciplines.
o Planetary Literacy: Ensuring every graduate understands the core principles of ecological systems and sustainable economics.
2. Global Mentorship & Fellowship Networks: We propose the creation of a Global Stewardship Fellowship, a publicly and privately funded initiative that places high-potential young adults into year-long, rotating apprenticeships across sectors—spending time in a ministerial office, a multinational corporation’s sustainability division, a UN agency, and a grassroots NGO. This builds empathy, systemic understanding, and a powerful professional network dedicated to the public good.
3. The “Civic Sandbox”: National and local governments should allocate dedicated “innovation budgets” and regulatory sandboxes for youth-led pilot projects. Whether it’s testing a universal basic income model in a municipality, deploying blockchain for land registry transparency, or piloting a zero-waste circular economy program, these sandboxes provide the critical space for experimentation, managed failure, and scalable success.
Pillar Two: Structural Integration – From Tokenism to Tenured Influence
Preparation must be met with irrevocable access. We must engineer specific, mandated entry points into leadership.
1. Legislated Quotas for “Next-Gen Leadership Roles”: We advocate for national legislation requiring that a minimum percentage (e.g., 25-30%) of all senior governmental advisory roles, board positions in state-owned enterprises, and diplomatic corps slots be filled by individuals under 35, selected through meritocratic and competitive processes. These cannot be silent roles; they must carry voting rights, budgetary oversight, and public reporting responsibilities.
2. Mandatory Youth Policy Advisory Panels: Beyond junior minister roles, every major ministry or department should be required to establish a Mandatory Youth Policy Advisory Panel. This formally recognized body, composed of young experts and representatives, would receive all non-classified policy briefings and legislative drafts. Their mandate would be to produce and publish independent, alternative analyses, impact assessments, and recommendations, which would then be formally submitted for official parliamentary or congressional review alongside the government’s proposals. This ensures their expert critique and innovative ideas become a mandatory part of the legislative record and public debate.
3. Intergenerational Co-Leadership Models: For specific, future-focused portfolios—such as Minister of Digital Transformation, Minister of Climate Resilience, or Minister of Future of Work—we propose a mandatory co-leadership model. One experienced administrator and one appointed youth leader would share the title and decision-making authority, forcing collaborative governance and instant knowledge transfer.
The Cross-Sectoral Dividend: Concrete Solutions Emerge
This structural inclusion is not an isolated political reform; it is the catalyst for unlocking solutions across every sector.
· Economic Renaissance: Young entrepreneurs are at the forefront of the purpose-driven economy. Their direct influence in economic ministries can redirect investment toward regenerative agriculture, renewable energy micro-grids, and the care economy, creating jobs while solving social problems. They are best positioned to formalize the vast informal sector through inclusive fintech and platform cooperatives.
· Accelerated Climate & Ecological Restoration: Young leaders treat the climate crisis with the urgency it demands. Their inclusion moves debates from cost distribution to opportunity creation, prioritizing investments in green infrastructure, biodiversity credits, and just transition policies that are both socially fair and ecologically sound.
· Trust-Based Technological Governance: From data privacy to algorithmic accountability, young digital natives can design governance frameworks that protect citizens without stifling innovation. They can pioneer models for digital public infrastructure, data cooperatives, and civic tech that enhance transparency and rebuild public trust.
· Social Cohesion and Narrative Renewal: Having often grown up in more diverse societies, young leaders can design immigration policies that are humane and economically smart, craft narratives that counter polarization, and rebuild community fabric through culture and sport, addressing the loneliness and alienation that fuel extremism.
The Imperative for a Global Commitment: From Isolated Action to Collective Norm
This cannot be a piecemeal, nation-by-nation endeavor. The scale of our interconnected challenges demands a synchronized, normative shift.
We therefore call for the immediate development and ratification of a Global Framework for Intergenerational Partnership (GFIP), to be adopted at the United Nations General Assembly. This Framework would:
1. Establish Clear Metrics: Create a standardized index measuring youth inclusion in legislatures, cabinets, corporate boards, and diplomatic missions, with annual public reporting and peer review.
2. Create a Financing Mechanism: Launch a dedicated global fund, capitalized by sovereign and private contributions, to finance the Global Stewardship Fellowship, Civic Sandboxes, and youth policy incubators worldwide.
3. Institute Diplomatic Recognition: Incorporate a nation’s GFIP compliance and performance into international assessments, credit ratings, and partnership considerations, making intergenerational equity a core component of a nation’s global standing.
A Final Word to Two Generations:
To Emerging Leaders: Your mandate is to prepare with relentless rigor. Master the details, but never lose the vision. Cultivate the humility to learn from the past and the courage to redesign the future. Lead with evidence, empathy, and an unwavering commitment to integrity.
To Established Leaders: Your defining legacy lies in the leaders you raise, not just the monuments you build. True statesmanship in this century is measured by your ability to voluntarily share power, to mentor without condescension, and to institutionalize pathways that make your own position, one day, gracefully obsolete in a better system. This is the highest form of patriotism and planetary stewardship.
True leadership is measured not by the monuments it builds, but by the successors it empowers. The urgent task of our time is to forge an unbreakable partnership between experience and vision—to build the scaffolding for the next generation to stand higher than we ever could.
The status quo is a failing strategy. The New Intergenerational Partnership is the pragmatic pathway forward. The time for deliberation has passed; the era of implementation must begin.
Dr. Tolulope A. Adegoke, AMBP-UN is a Doctor of Philosophy (PhD) in History and International Studies, Fellow Certified Management Consultant & Specialist, Fellow Certified Human Resource Management Professional, a Recipient of the Nigerian Role Models Award (2024), and a Distinguished Ambassador For World Peace (AMBP-UN). He has also gained inclusion in the prestigious compendium, “Nigeria @65: Leaders of Distinction”
Related
Uncategorized
In a RUDE World, Organisations Are Learning to Stay CALM
Published
4 months agoon
November 27, 2025By
Admin
In an age shaped by volatility, rapid shifts and relentless uncertainty, experts are urging organisations to rethink the very foundations of how they understand and respond to risk. The global business terrain is no longer defined by tidy cycles or predictable patterns.
It has morphed into what analysts now describe as a RUDE world: Random, Unpredictable, Dynamic and Entropic. These forces, once mere academic abstractions, now sit at the heart of every crisis briefing and boardroom conversation.
The consequences of ignoring this reality have been played out repeatedly on the global stage. Companies that cling to reactive strategies find themselves swamped by disruptions that arrive faster and hit harder than anything prior generations endured. Financial shocks, supply chain collapses, cybersecurity breaches and sudden reputational storms have shown that risks rarely stay contained. They jump boundaries, multiply and collide in ways that defy traditional planning.
A growing body of thought argues that the strategic antidote is a CALM response. CALM, which stands for Consistent, Anticipatory, Logical and Measured, offers a deliberate move away from firefighting and towards resilient, disciplined decision making. It urges organisations to stop chasing crises and start building systems that can hold steady even when the world does not.
A new book on the subject crystallises this shift by presenting a panoramic map of organisational exposure: fifty distinct risk categories, grouped into seven interconnected families. Far from being a checklist of threats, this framework functions as a living ecosystem. It invites leaders to stop examining risk as isolated problems and instead see the company as an integrated organism where one failure can cascade into many.
Beyond offering structure, the fifty categories serve as a diagnostic lens that widens an organisation’s field of vision. Each category highlights a particular pressure point, but their real power emerges when viewed together. Patterns surface that no siloed team could detect alone. A technical risk may quietly trigger a reputational issue, which then influences regulatory exposure, which eventually feeds into operational disruption. The framework forces executives to confront an uncomfortable truth: vulnerabilities rarely travel alone. By mapping risks this way, organisations gain an early warning system that sharpens judgment, strengthens preparedness and transforms vague uncertainty into targeted, informed action.
The RUDE characteristics explain why this broader lens is essential. Randomness describes shocks that arrive without pattern, making historical trends all but useless. Unpredictability captures the sudden appearance of new forces, from emerging technologies to cultural shifts, that can upend an industry overnight. The dynamic nature of global systems ensures that a decision made in a single office can send tremors through an entire enterprise. Entropy, the most insidious of the four, reflects internal decay: wasted energy, fading accountability and the slow erosion of organisational purpose.
Each threat finds its counterbalance in the CALM disciplines. Consistency stabilises organisations against random shocks. Anticipation replaces uncertainty with informed foresight. Logic cuts through dynamic complexity with clarity. A measured approach resists the quiet drift into disorder.
The danger of ignoring this interconnectedness is illustrated most clearly in the anatomy of a cybersecurity breach. What begins as a technical problem quickly spirals into a legal battle, a reputational crisis, a financial strain and, ultimately, an internal cultural wound that erodes trust. Treating such a crisis as an IT issue alone blinds organisations to the wider fallout. This fragmentation is the hidden vulnerability of modern business, and it is precisely what the RUDE framework seeks to eliminate.
The authors argue that RUDE creates a shared language for institutions that have long struggled to speak across departmental divides. It exposes the threads that link one risk to another. Most importantly, it embeds foresight into everyday operations, allowing leaders to predict how a small disturbance could morph into a systemic threat.
The message resounding through the research is unequivocal. Risk management can no longer be confined to compliance manuals or crisis playbooks. In a RUDE world, risk is not only a hazard; it is a resource, a source of competitive intelligence and strategic advantage. A mature, integrated risk program becomes less like a brake and more like a steering wheel, guiding organisations with confidence through turbulence that once seemed uncontrollable.
For leaders determined not just to survive disruption but to navigate it with mastery, the shift from RUDE to CALM is emerging as a strategic necessity. The stormy future remains, but with the right framework, it becomes something that can be read, understood and navigated. The waves keep rising, yet the organisation learns how to sail.
Related


FIFA Lists Six Females Among 52 Referees for 2026 World Cup

Terrorists Kill Nigerian Brigadier-General – AFP Report

Again, Iran Blocks Strait of Hormuz, Alleges Ceasefire Violation

Why Tinubu Was Absent at Commissioning of Sanwo-Olu’s Projects in Lagos – Presidency

Koumagnon Family Pledges Unalloyed Support for Romuald Wadagni As President

Trump Accuses Nigeria of Spreading Fake News on Iran Ceasefire Deal

Benin Republic 2026: Romuald Wadagni, The President in Waiting

Effective Strategic Leadership: Resolving Nigeria’s Contemporary Challenges and Unlocking Inclusive Possibilities

‘ADC Membership Hits 500,000 after INEC Derecognition of Leadership’

The Ponnles Honour Parents With N150m Memorial Endowment at OAU

Evangelist Ebenezer Obey: Celebrating a Music Maestro at 84

Sorrow, Tears, Love As Ex-Ovation Editor, Mike Effiong, Buries Wife, Kemi in Lagos

ADC Raises Alarm over INEC’s Plot to Prevent Party from Fielding Candidates

Is Amupitan’s INEC Complicit?
Trending
-
 Opinion5 days ago
Effective Strategic Leadership: Resolving Nigeria’s Contemporary Challenges and Unlocking Inclusive Possibilities
-
 News4 days ago
‘ADC Membership Hits 500,000 after INEC Derecognition of Leadership’
-
 Events6 days ago
The Ponnles Honour Parents With N150m Memorial Endowment at OAU
-
 Boss Of The Week6 days ago
Evangelist Ebenezer Obey: Celebrating a Music Maestro at 84
-
 Events6 days ago
Sorrow, Tears, Love As Ex-Ovation Editor, Mike Effiong, Buries Wife, Kemi in Lagos
-
 Featured4 days ago
ADC Raises Alarm over INEC’s Plot to Prevent Party from Fielding Candidates
-
 Headline5 days ago
Is Amupitan’s INEC Complicit?
-

 World2 days ago
Trump Delays Iran’s Strike by 2-Weeks As Pakistani Leaders Intervene